

The OEE Trust Gate: What to Check Before You Let a Dashboard Judge a Shift
A practical trust gate for Chennai auto-component plant managers: seven data checks and a one-shift validation sprint before you use OEE to judge a shift.
TechCloud

Direct answer: An OEE dashboard is trustworthy enough to judge a shift only after you have verified seven things: the shift calendar, the part-to-cycle-time link, the machine-state signal, the unit count, the reason-code completeness, the shift-boundary reconciliation, and a known error rate against ground truth. If any one of those is unverified, the dashboard is a monitoring aid, not a performance verdict.
Most Chennai auto-component plants do not have an OEE data problem. They have an OEE trust problem. The dashboard looks precise. The percentage has two decimal places. The morning meeting starts with the number. And then a supervisor says, “That’s not what happened on the floor.” Both people can be right. An OEE dashboard can be mathematically correct and still misrepresent the shift.
This guide gives you a pre-shift trust gate—seven checks to run before you use the dashboard to judge a shift—and a one-shift validation sprint you can run on one line, in one shift, without buying new software.
Why this matters more in Chennai’s auto cluster
Chennai’s auto-component base is not a generic manufacturing market. Plants in Ambattur, Sriperumbudur, Oragadam and the wider corridor supply OEMs under IATF 16949 expectations, PPAP discipline and delivery-rating pressure. A dashboard that overstates OEE by 15–25 percentage points is not just an internal reporting error. It can distort capacity promises, hide the real constraint before an OEM audit, and make a plant look better on a screen than it is on the floor.
The fix is not “buy a better dashboard.” The fix is to validate the data contract behind the dashboard before you use it to judge a shift.
The dashboard is not the problem — the data contract is
OEE is a multiplication of three things: Availability, Performance and Quality. The formula is simple. Making each input mean the same thing across shifts, machines and product changes is not.
Four failure modes explain most distrust:
- Manual end-of-shift reconstruction. Operators rebuild the shift from memory. Micro-stops under five minutes are skipped. Manual systems typically capture only 60–70% of actual downtime, and manual OEE is often overestimated by 10–25%.
- Definition drift. One shift treats a changeover as planned downtime; another treats it as unplanned. The same events produce different OEE numbers.
- Signal ambiguity. A motor-running signal does not prove good parts are being made. A cycle signal and a run signal are not the same thing.
- Reason-code noise. “Other” becomes the largest downtime category. The number is complete enough to calculate OEE but too vague to diagnose loss.
A trustworthy dashboard is not one that displays OEE. It is one where the inputs are defined, captured and reconciled before the OEE calculation is allowed to speak.
The 7-point OEE trust gate
Run these checks before you use any OEE dashboard to judge a shift. Each check is either Pass (verified in the current production context) or Fix (unverified or known to be wrong). Do not average them into a score and call it “80% trustworthy.” The gate is binary: if a check is unverified, the dashboard is not ready for shift judgment.
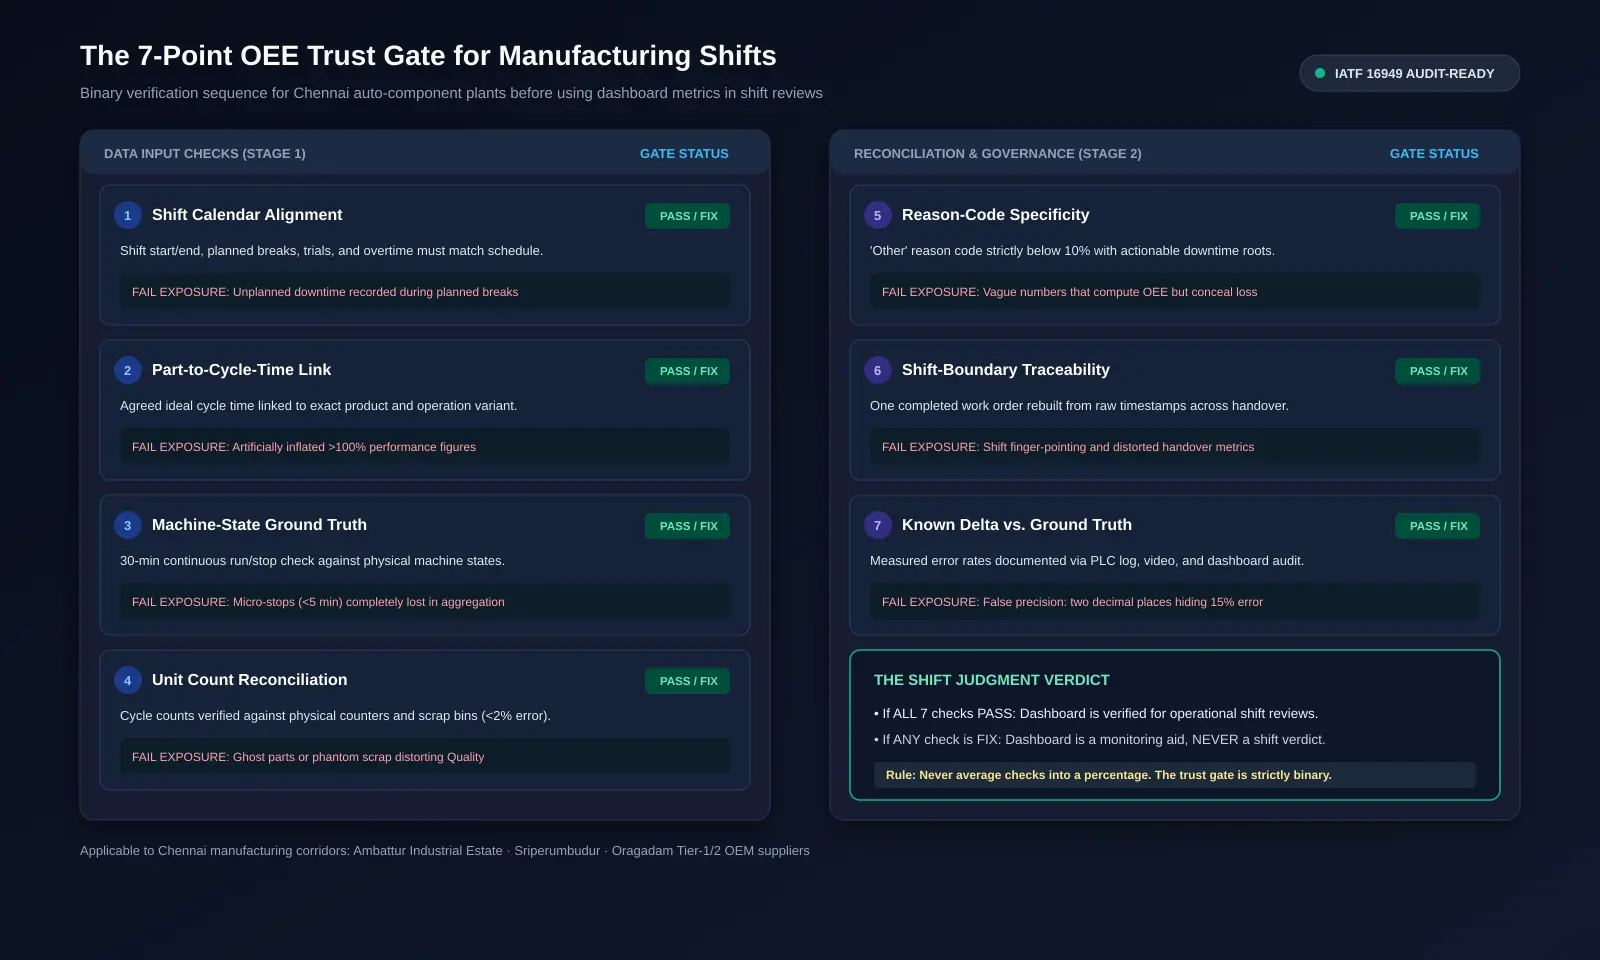
1. Is the shift calendar correct?
Verify shift start and end, planned breaks, overtime, planned maintenance, trials and unmanned time. A machine stopped during a scheduled break should not create unplanned downtime. Production outside the schedule must be accounted for, not silently excluded.
Pass condition: The system’s planned production time matches the actual production plan for the shift, and exceptions are documented.
2. Is every part linked to the correct ideal cycle time?
Performance depends on the agreed ideal cycle time for the product and operation. If the cycle time is too long, Performance looks better without any real improvement. If the part-to-cycle-time link is wrong, the OEE number is wrong even if the machine signal is perfect.
Pass condition: A sample of parts run in the shift can be traced to the correct cycle time, and no performance figure exceeds 100% without an explained reason.
3. Does the machine-state signal capture actual run and stop states?
Observe a defined production run at the machine and compare it with the system log. Check when run state starts and ends, whether micro-stops are recorded, and whether signal drops or duplicate counts occur. A PLC signal is closer to ground truth than a manual log, but it still needs interpretation.
Pass condition: The system log matches observed run/stop states for a continuous 30-minute window, including at least one short stop.
4. Do total and good unit counts match an independent source?
Compare logged quantities against a physical counter, a reconciled order, or a second independent count. Confirm that units of measure match and that scrap, rework and post-shift quality releases are treated consistently.
Pass condition: The count error is known and within a documented tolerance (for example, under 2% for cycle counts in the audit sample).
5. Are downtime reasons complete and specific enough to act on?
Track uncoded downtime and the “Other” rate. A high coding rate is useless if codes are inaccurate or overly broad. Check whether different shifts record the same incident differently.
Pass condition: “Other” is below 10% of downtime events in the shift sample, and the top three loss reasons are specific enough to assign an action.
6. Can you reconcile one completed work order across the shift boundary?
This is the check most dashboards fail. Pick one work order that started before the shift and finished during it. Rebuild the time and count records from raw events, not from the dashboard summary. If the dashboard cannot be rebuilt from a small set of accepted records, it is not auditable.
Pass condition: One completed work order reconciles from raw events to the displayed OEE within a documented tolerance.
7. Do you know the dashboard’s error rate against ground truth?
A dashboard is not “trusted” because it looks consistent. It is trusted because its error rate against an independent source has been measured. Run a one-shift audit with three independent sources: PLC raw log, video or in-person observation, and the reported dashboard data. Record the error rates for cycle count, downtime, reason codes and parts.
Pass condition: Error rates are known, documented, and inside the plant’s tolerance for the decisions the dashboard will inform. If no error rate is known, the gate is not passed.
The one-shift validation sprint
You do not need a quarter-long data-governance programme to start. Run this on one representative line, in one shift.
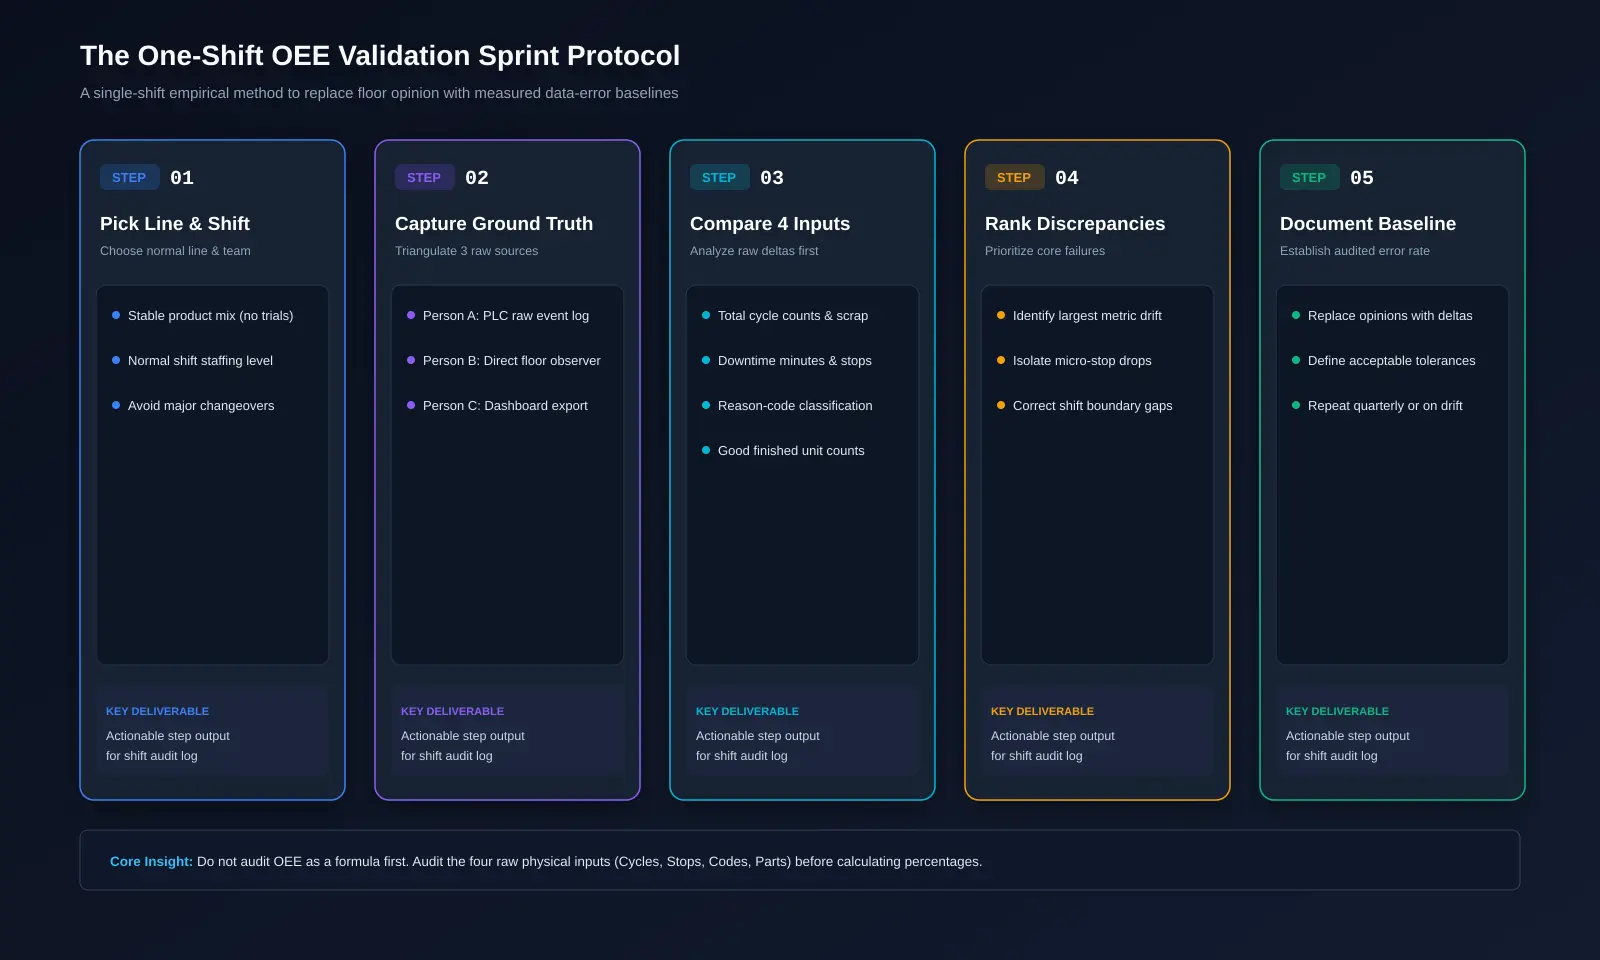
- Pick the line and the shift. Choose a line that runs a stable product mix and a shift with normal staffing. Avoid a shift with a planned trial or a major changeover.
- Capture ground truth in parallel. Assign one person to record the PLC raw log, one to observe the machine and operator, and one to pull the dashboard’s reported data for the same window.
- Compare four fields. Cycle count, downtime total, reason codes and good-part count. Do not start with OEE. Start with the inputs.
- Rank discrepancies by impact. Which error most changes the OEE number or the action the shift team would take? Fix that first.
- Document the baseline. Record the error rates and the date. Re-audit quarterly or whenever the product, schedule or machine signal changes.
This sprint is deliberately small. Its purpose is not to prove the dashboard is perfect. Its purpose is to replace opinion with a measured error rate.
Shift-boundary reconciliation: the check that exposes false precision
Most OEE disputes happen at the boundary between shifts. A work order starts on second shift and finishes on third. The dashboard assigns counts and downtime to one shift, but the floor knows the loss happened in the other.
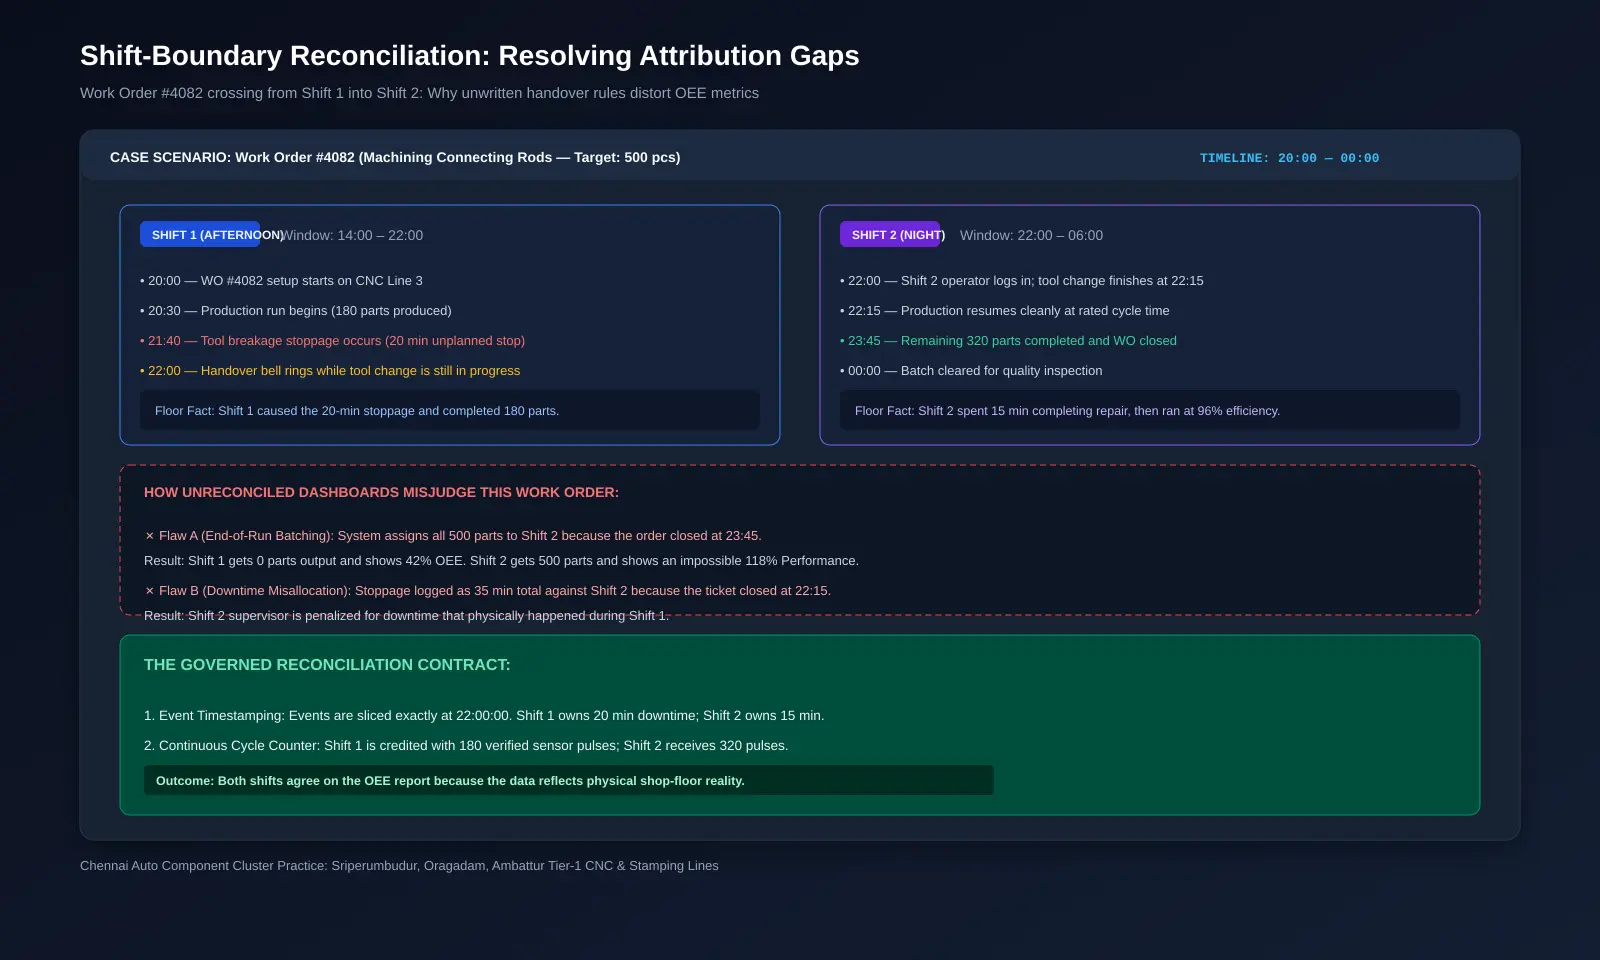
The reconciliation method is simple:
- Select one completed work order that crosses a shift boundary.
- Rebuild the timeline from raw machine events and operator reason entries.
- Assign each event to the shift that owned the time window, using a written rule.
- Compare the rebuilt OEE to the dashboard’s shift-level OEE.
- If the difference is larger than the plant’s tolerance, the shift-boundary rule is not trustworthy.
This is not a technical nicety. It is the difference between a shift review that changes behaviour and a shift review that changes nothing.
When to stop trusting the dashboard
Stop using the dashboard to judge a shift if any of the following is true:
- The “Other” reason code is the largest downtime category.
- A performance figure exceeds 100% without an explained reason.
- The same machine shows different OEE values in two reports for the same window.
- No one can rebuild a completed work order from raw events.
- The error rate against ground truth is unknown.
- The reason-code taxonomy changed without a documented version.
In these cases, use the dashboard for monitoring—“something may be happening”—but not for judgment—“this shift underperformed.”
What “good” looks like
A trustworthy OEE dashboard does not need to be expensive. It needs to be auditable. That means: defined shift rules, part-to-cycle-time links, machine-state signals that match observation, counts that reconcile to an independent source, specific reason codes, a shift-boundary rule, and a known error rate. If those are in place, the OEE number can be used to judge a shift. If they are not, the number is a conversation starter, not a verdict.
Frequently Asked Questions
How do I know if my OEE dashboard is accurate?
You know it is accurate only after you have measured its error rate against an independent source for a specific line and shift. A dashboard that looks consistent is not the same as a dashboard that is accurate.
Why do operators and managers disagree about the same shift?
They are often looking at different data contracts. Managers see the dashboard’s aggregated OEE; operators see the events that were missed, miscoded or assigned to the wrong shift. Shift-boundary reconciliation and reason-code review usually explain the gap.
What is a reasonable data-quality error rate for OEE?
There is no universal number. A common audit target is under 2% error on cycle counts and under 5% under-reporting on downtime, but the right tolerance depends on the decisions the number will inform. Document your tolerance and measure against it.
Can I trust an OEE dashboard if the reason codes are incomplete?
No. Incomplete reason codes may still produce a mathematically correct OEE, but they remove the diagnostic value. If “Other” is the top reason, the dashboard cannot tell you what to fix.
How often should I audit OEE data?
Audit quarterly, and re-audit whenever the product mix, schedule, machine signal or reason-code taxonomy changes. A one-shift sprint at each change is enough to catch drift early.
Does automation guarantee a trustworthy OEE dashboard?
No. Automation removes manual entry errors, but it does not guarantee that the signal means what you think it means. A motor-running signal does not prove good parts are being made. Automated data still needs definition control and reconciliation.
Where this fits
This post sits under Manufacturing & Industrial Software > OEE & Production Analytics. If you are building or replacing an OEE data pipeline, start with the validation requirements before you compare dashboard vendors.
If you are connecting machine sensor streams to ERPs or supervisory platforms, review our practical guide on AI workflow automation and APIs for the architectural patterns that keep data contracts explicit. For complex telemetry pipelines, teams rely on dedicated integration and data workflow consulting or engage our custom software development practice to engineer tamper-evident machine logs.
Conclusion
Before you let an OEE dashboard judge a shift, make it pass the trust gate. Pick one line, run the one-shift validation sprint, reconcile one work order across a shift boundary, and record the error rate. If the dashboard passes, you can use it with confidence. If it does not, you now know exactly what to fix.
If you need help building an OEE data pipeline that is validation-ready from day one—with explicit data contracts, shift-boundary rules and auditable reason codes—talk to Juhenza about your manufacturing data project or explore our published client case studies to see how we build reliable production data systems.
References
- FlowFuse, OEE Is Misleading Your Factory: Here’s How to Fix It (2026). FlowFuse Analysis. Analysis of manual OEE overestimation and micro-stop blindspots.
- Fabrico, Manufacturing Data Quality Audit: How to Find Out If Your OEE Numbers Are Lying. Fabrico Research. One-day audit protocol with three independent sources.
- Good Solutions, How do you ensure data quality in an OEE system?. Good Solutions Quality Framework. Six essential data verification checks before shift meetings.